The New Thinking on KPIs, part 3 of 4

The four types of performance measures

I have come to the conclusion that there are four types of performance measures, as shown in Figure 3. This conclusion has come from: the research I have conducted; workshop feedback across diverse industries; and as a by-product of writing my book “Key Performance Indicators – developing, implementing and using winning KPIs”.


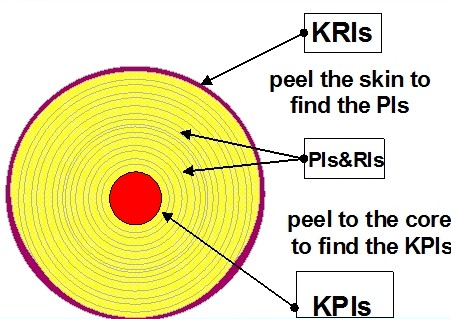
Figure 3: A scorecard with six perspectives

  • key result indicators (KRIs) – give an overview on past performance and are ideal for the Board as they communicate how management have done in a critical success factor or balanced scorecard perspective
  • performance indicators (PIs) – tell staff and management what to do
  • result indicators (RIs) – tell staff what they have done
  • key performance indicators (KPIs) – tell staff and management what to do to increase performance dramatically.

[wcm_restrict]I use an onion analogy to describe the relationship of these four measures. The outside skin describes the overall condition of the onion, how much sun, water and nutrients it has received, how it has been handled from harvest to supermarket shelf. The outside skin is thus a key result indicator. The layers represent the various performance and result indicators and the core is where you find the key performance indicators.

Another way to look at it is to say there are two groups of measures, result indicators that summarize activities and performance indicators that are tied to a precise activity.

The 10/80/10 rule

Kaplan and Norton recommend no more than 20 KPIs, and Jeremy Hope (of beyond budgeting fame) suggest less than 10. To aid those involve in performance measurement I have developed the 10/80/10 rule. This means an organisation should have about 10 KRIs, up to 80 PIs and RIs and 10 KPIs. Very seldom is there a need for more measures than these numbers, and in many cases, less measures can be used.

Key Result Indicators (KRIs)

The common characteristic of KRIs is that they are the result of many actions. They give a clear picture of whether you are travelling in the right direction, and of the progress made towards achieving desired outcomes and strategies. They are ideal for governance reporting as key result indicators show overall performance and help the Board focus on strategic rather that management issues.

KRIs do not, however, tell management and staff what they need to do to achieve desired outcomes. Only performance indicators and KPIs can do this.

KRIs are measures that have often been mistaken for KPIs include:

  • Customer satisfaction
  • Net profit before tax
  • Profitability of customers
  • Employee satisfaction
  • Return on capital employed

Separating out KRIs from other measures has a profound impact the way performance is reported. There is now a separation of performance measures into those impacting governance (up to ten KRIs in a Board dashboard) and those RIs, PIs and KPIs impacting management.

A one page dashboard with the KRIs going in the right direction, will give confidence to the Board that the management know what they are doing and the “ship” is being steered in the right direction. The Board can then concentrate on what they do best, coaching the CEO, as required; focusing on the horizon for icebergs or looking for new ports to call. This is instead of parking themselves on the “bridge” and thus getting in the way of the captain who is trying to perform important day-to-day duties.

Performance and Result Indicators (PIs and RIs)

The 80 or so performance measures that lie between the KRIs and the KPIs are the performance and result indicators (PIs). The performance indicators while important are not “Key to the business”. The PIs help teams to align themselves with their organization’s strategy. PIs complement the KPIs and are shown with them on the organization’s, divisions’, departments’ and teams’ scorecards.

PIs could include:

  • % increase in sales to the top 10% of customers
  • # of employees’ suggestions implemented in last 30 days
  • Customer complaints from key customers
  • Sales calls organized for the next week, fortnight
  • Late deliveries to key customers

RIs could include:

  • Net profit on key product lines
  • Sales made yesterday
  • Weeks sales to key customers
  • Debtor collections in week
  • Bed utilization in week

Looking at the differences between KRIs vs KPIs and RIs vs PIs

Often in workshops one question emerges time and time again. “Please explain again the difference between KRIs and KPIs, and RIs and PIs.” Figures 4 and 5 will hopefully clarify the differences.

KRIs KPIs
Can be financial and non financial, e.g. Return on capital employed, and customer satisfaction percentage Non financial measures (not expressed in $s, Yen, Pds, Euro, etc)
Measures mainly monthly and some times quarterly Measured frequently e.g. daily or 24 by 7
As a summarize of progress in an organization’s critical success factor it is ideal to a Board. Acted upon by the CEO and senior management team
It does not help staff or management as no where does it tell what you need to fix All staff understand the measure and what corrective action is required
Commonly, the only person responsible for a KRI is the CEO. Responsibility can be tied down to the individual or team
A KRI is designed to summarize activity within one CSF Significant impact e.g. it impacts on more than one of top CSFs and more than one balanced scorecard perspective
A KRI is a result of many activities managed through a variety of performance measures Has a positive impact e.g. affects all other performance measures in a positive way
Normally reported by way of a trend graph covering at least the last fifteen moths of activity Normally reported by way of an intranet screen indicating activity, person responsible, track record etc so a phone call can be made.

Figure 4: The difference between KRIs and KPIs

A car’s speedometer provides a useful analogy to show the difference between a result indicator and a performance indicator. The speed the car is traveling is a result indicator since the cars speed is a combination of what gear the car is in and what revolutions the engine is doing. Performance indicators might be how economically the car is being driven e.g. a gauge showing how many kilometers per liter, or how hot the engine is running e.g. a temperature gauge.

RIs PIs
Can be financial and non financial Non financial measures (not expressed in $s)
Measured weekly, fortnightly, monthly, some times quarterly Same
Cannot be tied to a team or a discrete activity Tied to a discrete activity, and thus to a team
Does not tell you what you need to do more or less of All staff understand what action is required to improve PI
Designed to summarize some activity within a CSFs/SFs Specific activity impacts on one of the CSFs /SFs
A result of more than one activity Focuses on a specific activity
Normally reported in a team scorecard Same

Figure 5: The difference between RIs and PIs[/wcm_restrict][wcm_nonmember]


Hi there! This article is available for free. Simply register as a StrategyDriven Personal Business Advisor Self-Guided client by clicking here.

Already a client? Login to access this article.
 
[/wcm_nonmember]


About the Author

David Parmenter, author of Key Performance Indicators: Developing, Implementing, and Using Winning KPIs and Pareto’s 80/20 Rule for Corporate Accountants, is an international presenter who is known for his thought provoking and lively sessions, which have led to substantial change in many organizations. He is a leading expert in developing winning KPIs, replacing the annual planning process with quarterly rolling planning, accelerating month-end processes, and converting reporting to a decision based tool.

David’s work on KPIs has received international recognition with clients in Auckland, Wellington, Sydney, Melbourne, Brisbane, Adelaide, Canberra, Perth, Kuala Lumpur, Singapore, Tehran, Prague, Dublin, London, Birmingham, Manchester and Edinburgh. David is a fellow of the Institute of Chartered Accountants in England & Wales and has worked for Ernst & Young, BP Oil Ltd, Arthur Andersen, and Price Waterhouse Coopers.

David’s recent thinking is accessible from www.davidparmenter.com. He can be contacted at [email protected] or telephone +64 4 499 0007.

This articles is an extract from his “Implementing winning KPIs” whitepaper which can be downloaded from http://davidparmenter.com/how-to-guides)

0 replies

Leave a Reply

Want to join the discussion?
Feel free to contribute!

Leave a Reply

Your email address will not be published. Required fields are marked *